Northern Ireland’s industrial sector plays a pivotal role in the region’s economy, contributing significantly to employment, innovation, and economic output.
However, as the global community intensifies efforts to combat climate change and transition to a low-carbon future, understanding and optimising energy use and productivity within industry has become increasingly critical.
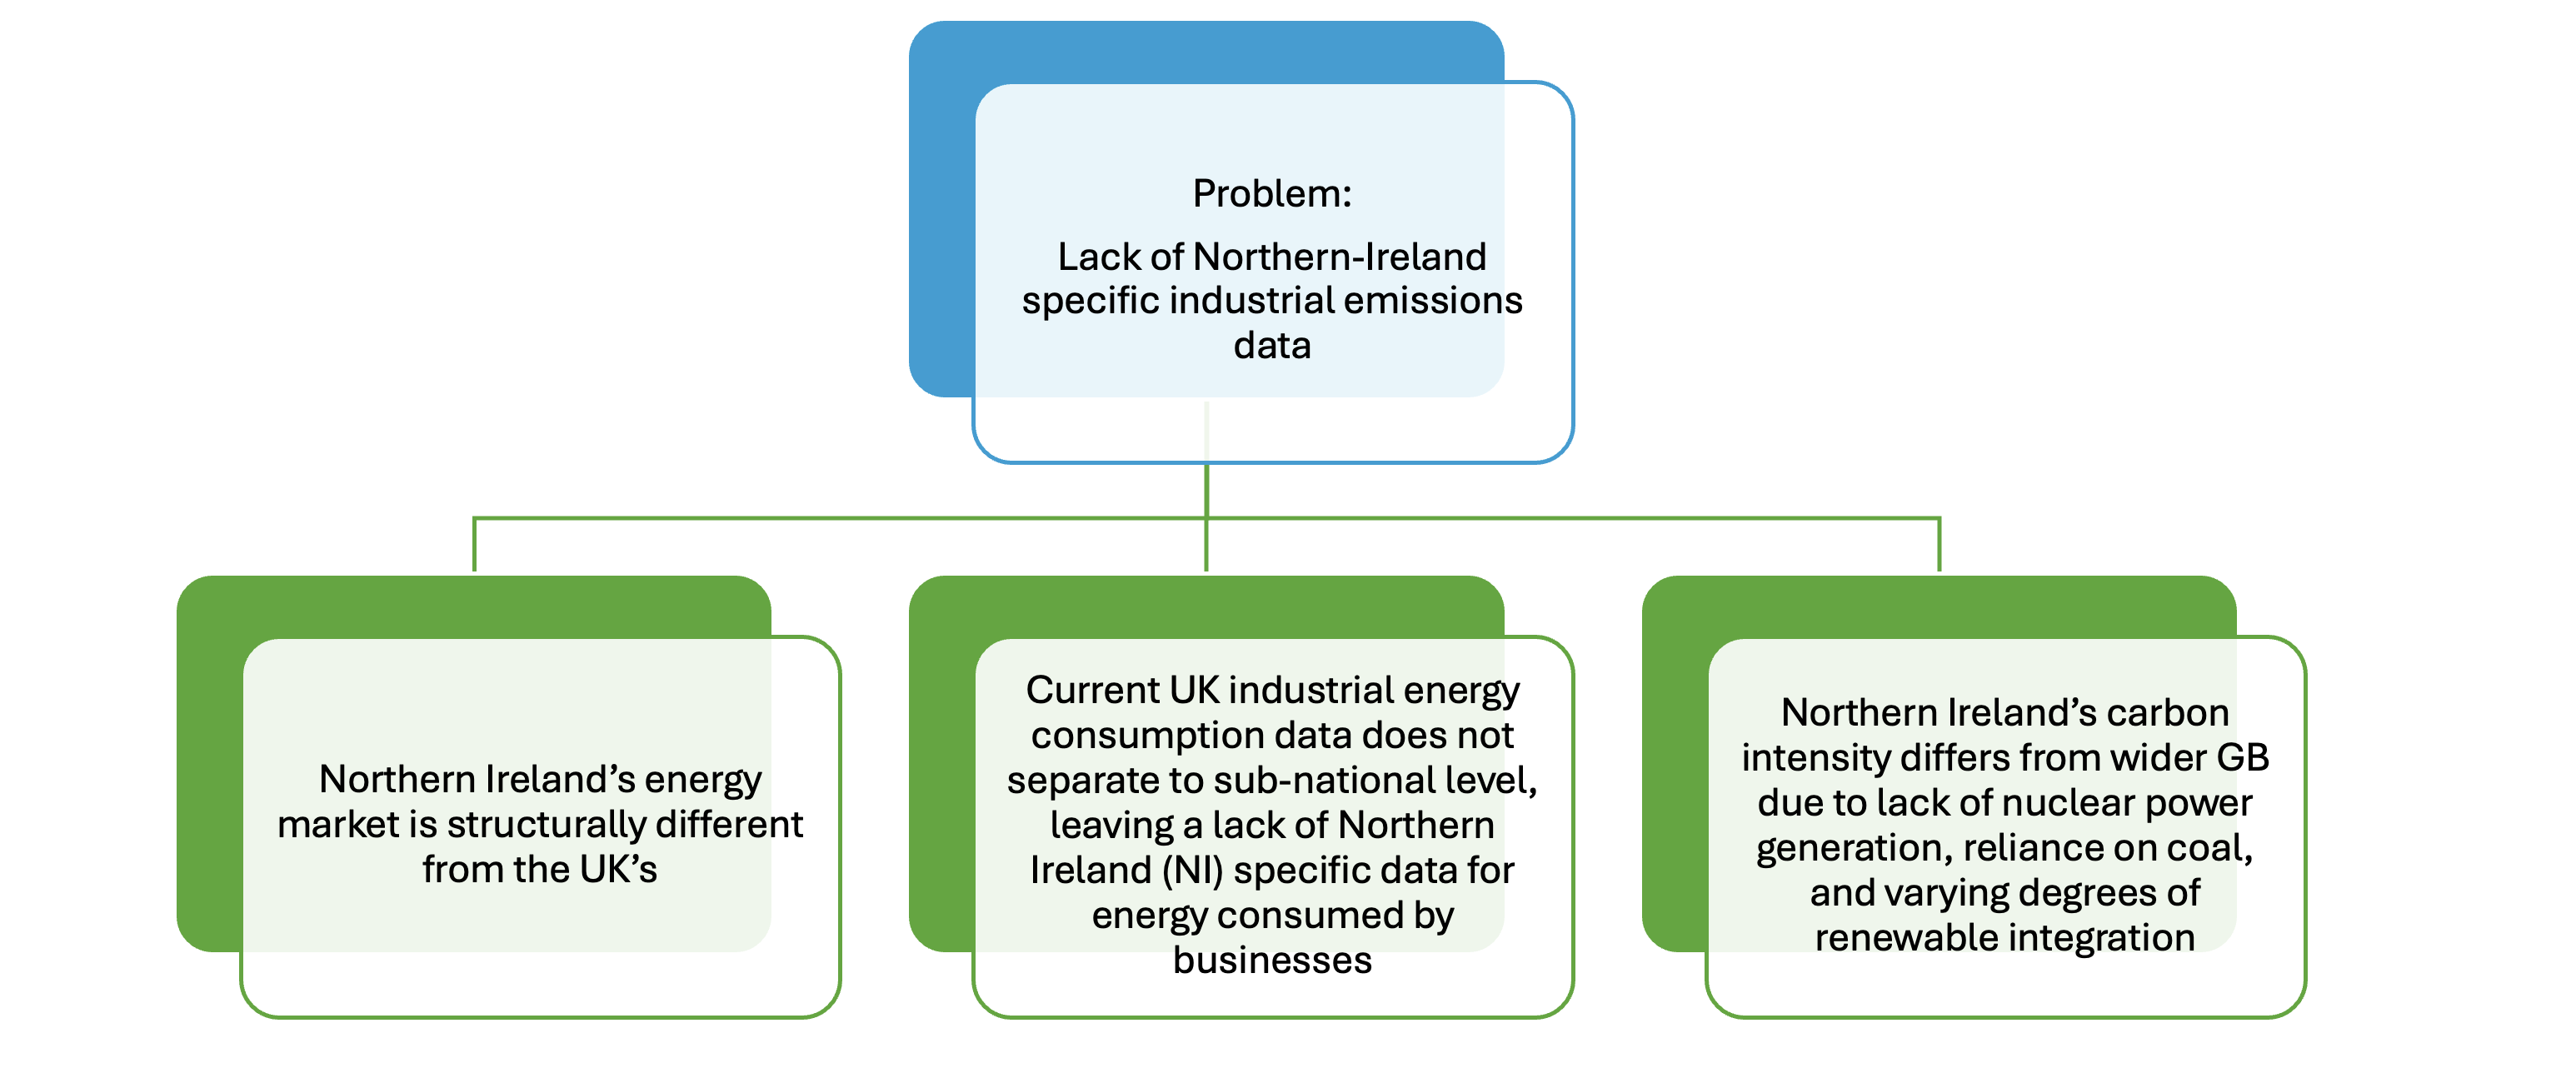
Accurate and comprehensive data on industrial emissions and productivity is essential for informing policy decisions, identifying energy efficiency opportunities, and supporting the development of sustainable energy strategies. Despite its importance, significant data gaps persist in Northern Ireland’s industrial energy use, hindering the ability to fully assess and address the sector’s energy demands and environmental impact.
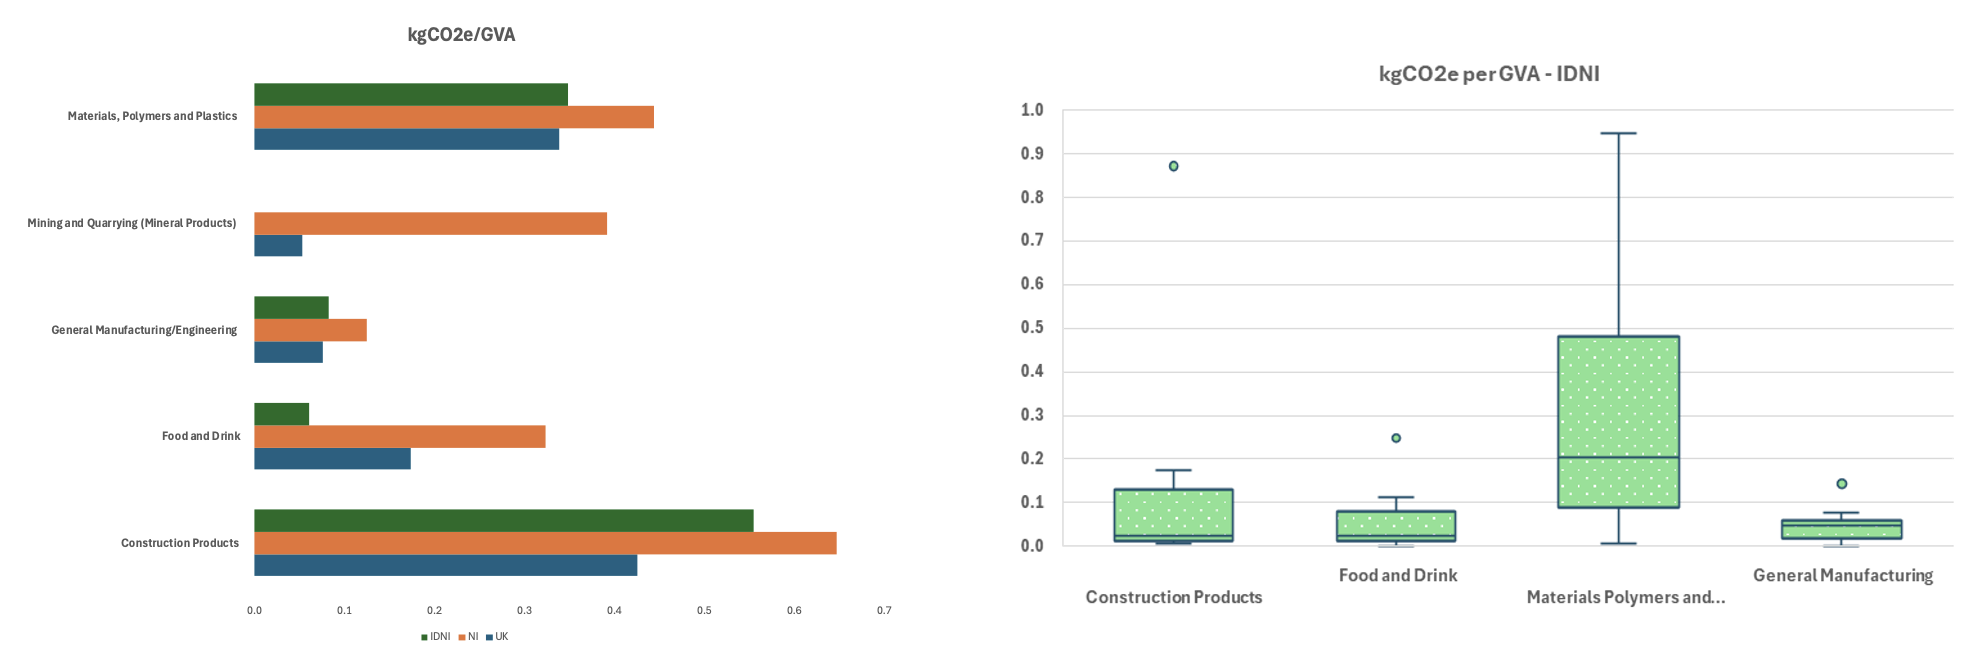
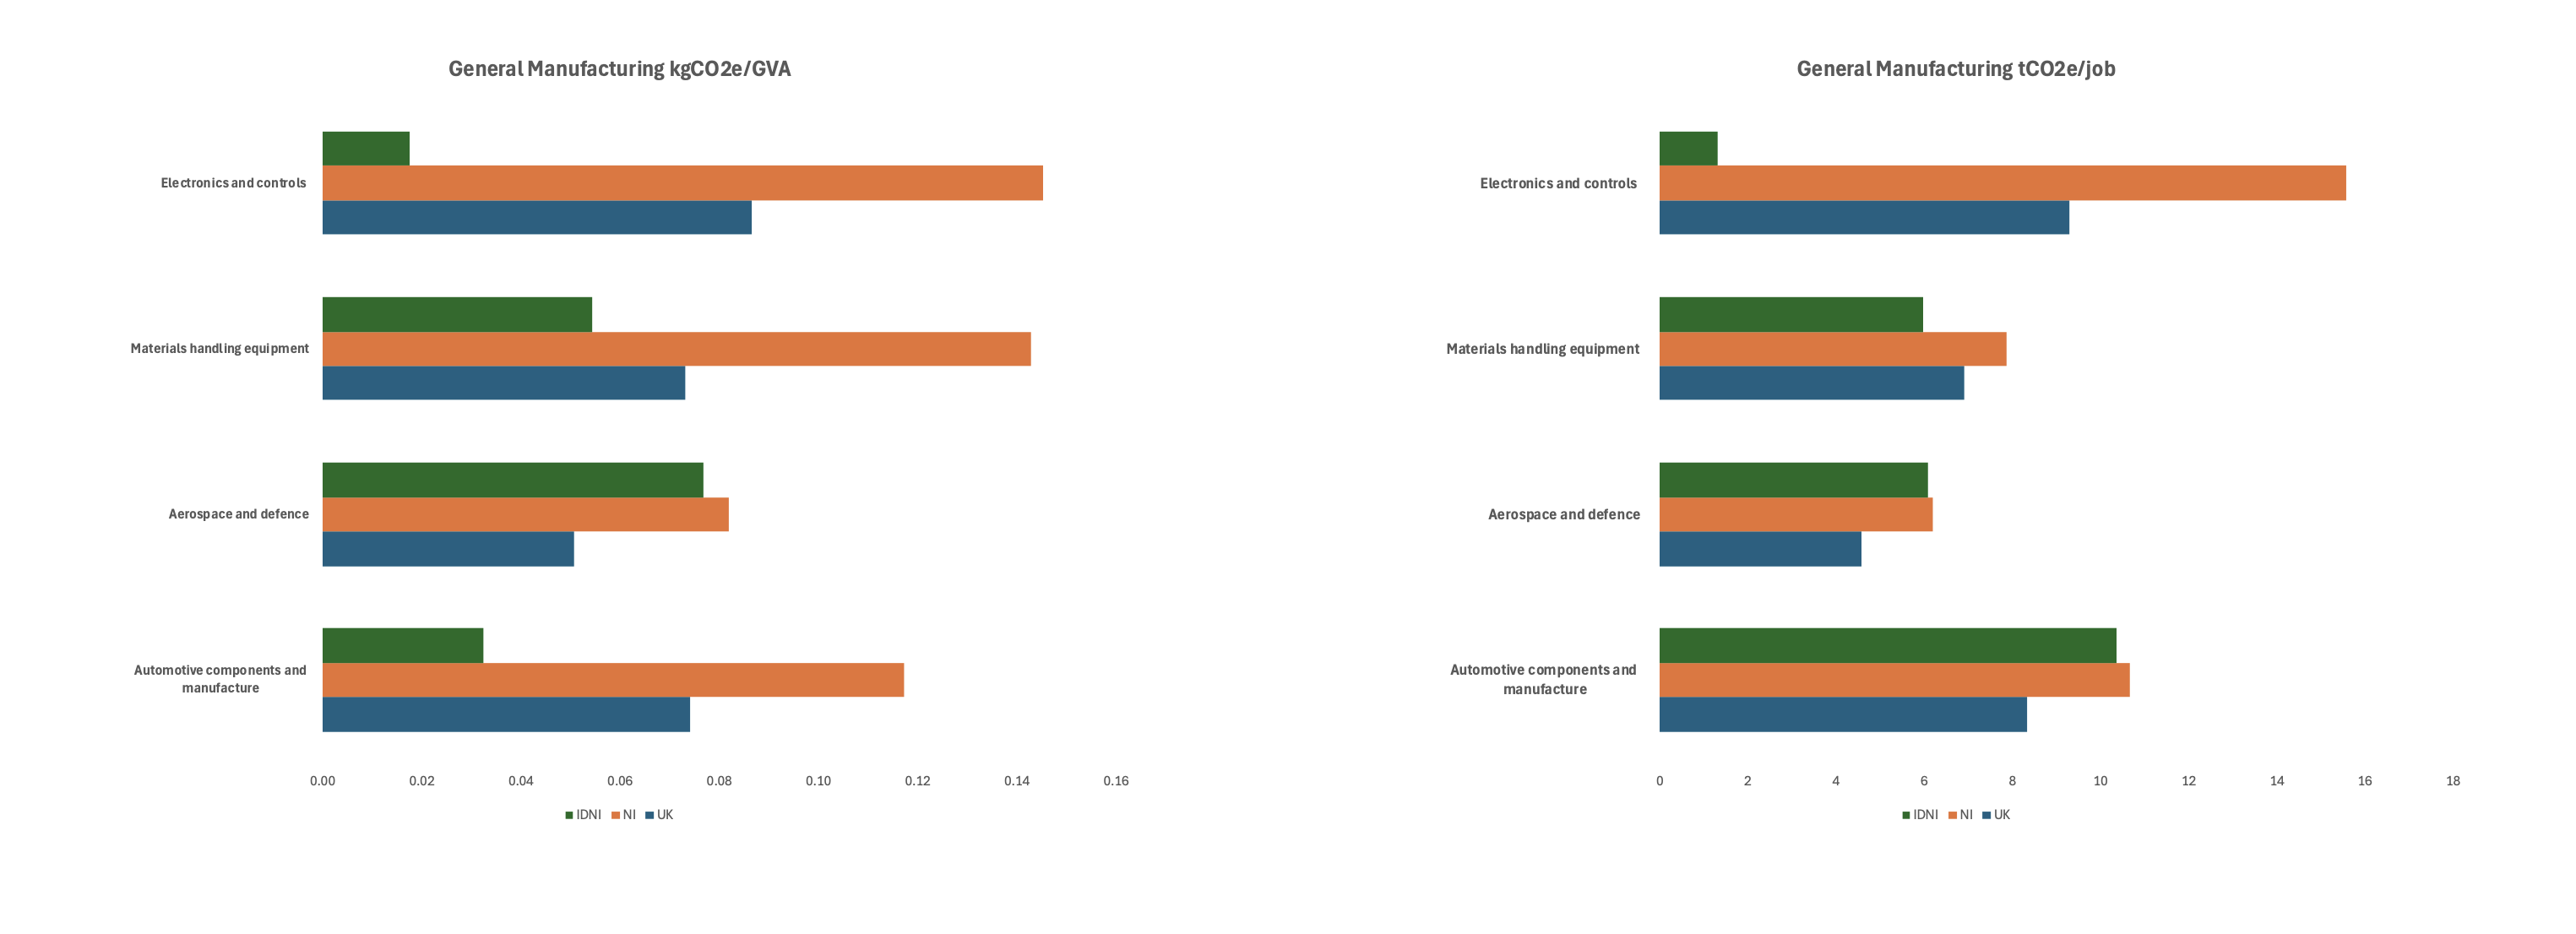
The first graph shows kgCO2e/GVA between each sector. The ‘IDNI’ figures represent data collected directly via the Industrial Decarbonisation Northern Ireland (IDNI) programme. ‘NI’ and ‘UK’ represent statistical data associated with Northern Ireland, and the United Kingdom, respectively.
The second graph indicates the impact of outliers skewing the datasets. A median line close to the lower quartile range indicate the high emission low value-added companies are pulling the distribution toward the higher end.
Outliers for General Manufacturing and Construction Products have been excluded from the second graph to improve readability
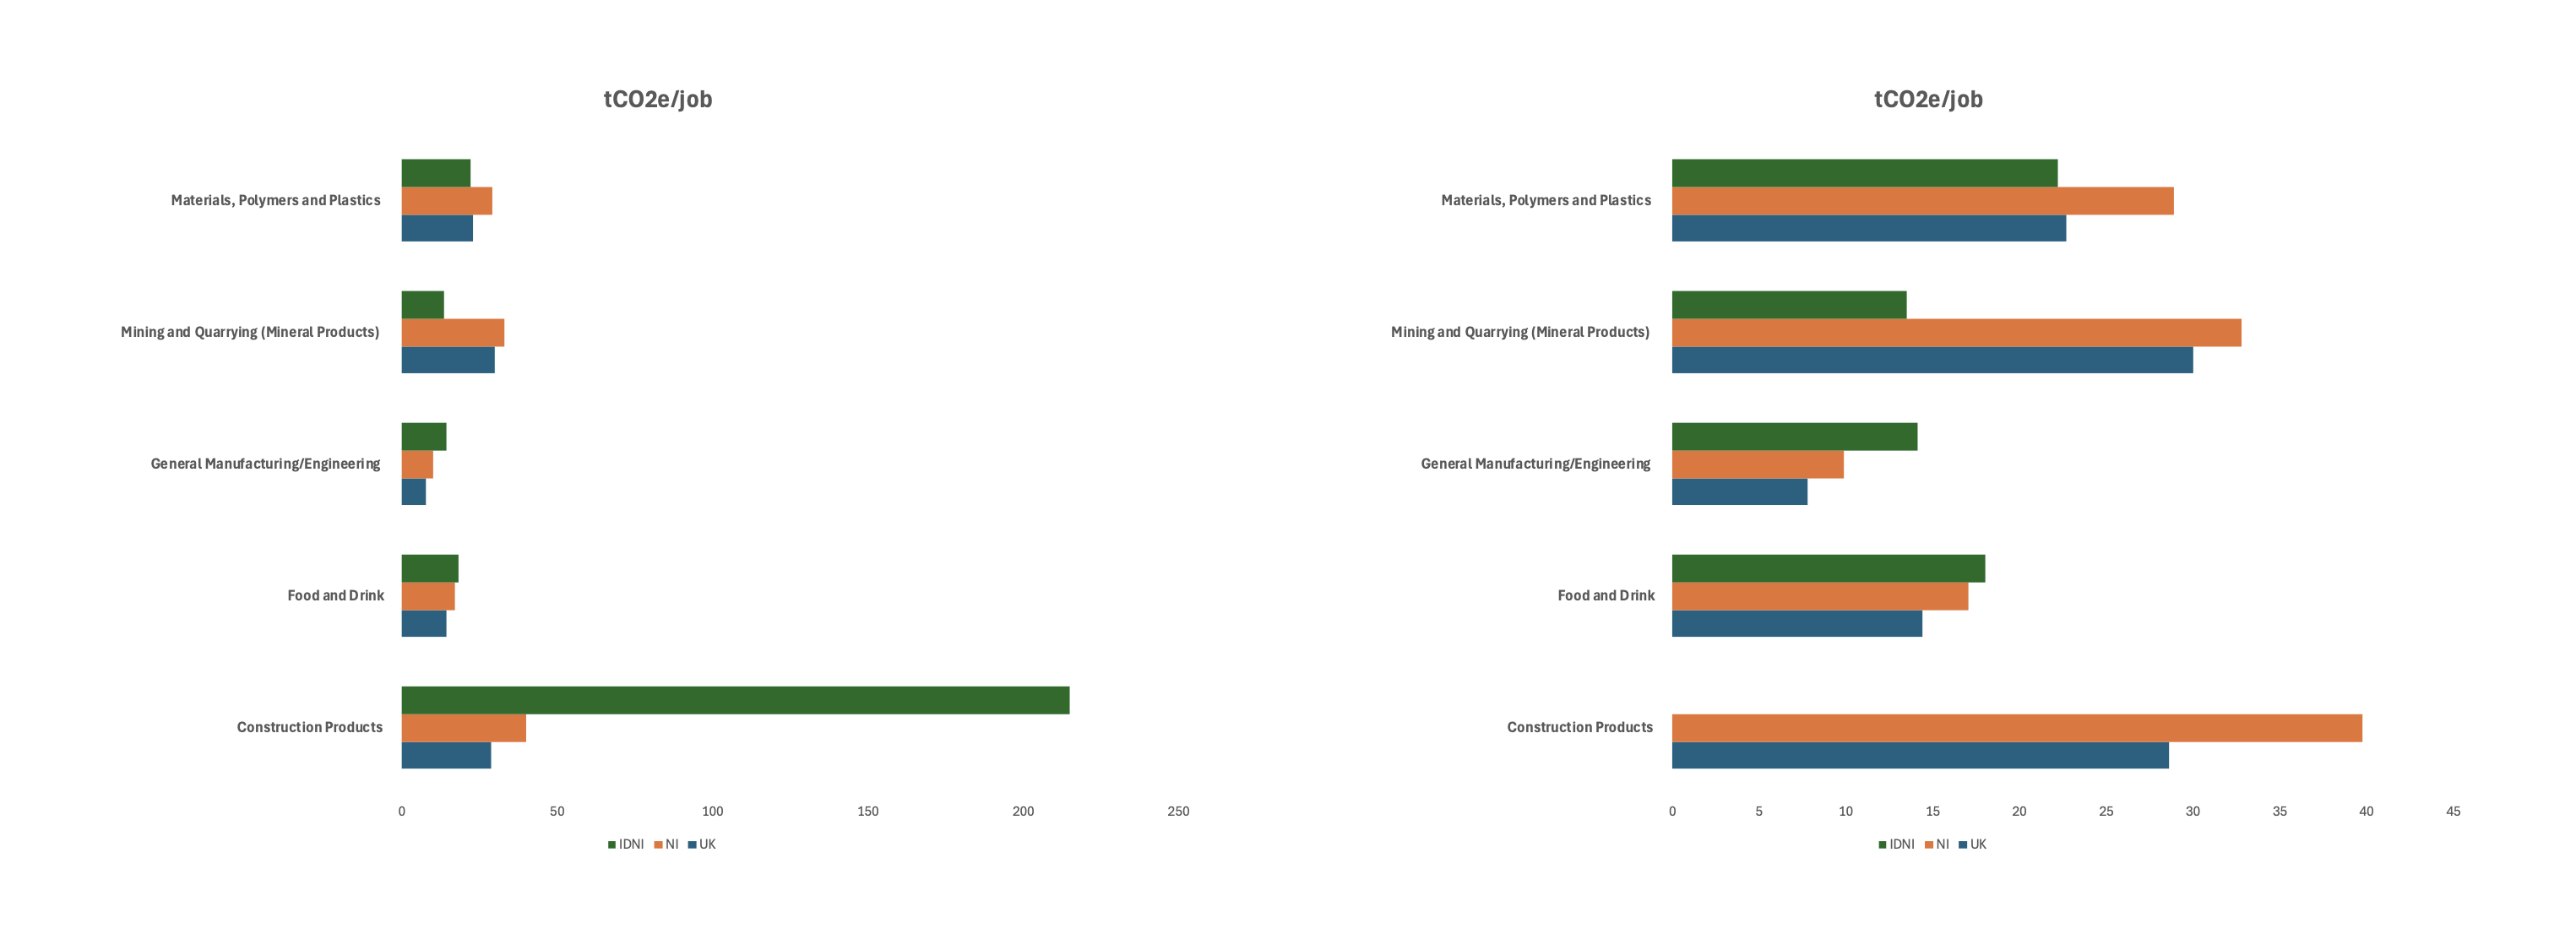
The first graph shows tCO2e/job between each sector. The charts indicate that emissions per employee are consistently higher in Northern Ireland than the UK. IDNI data collected for materials and mining archetypes suggest otherwise, but the sample size means this dataset should be approached with caution.
The second graph shows the same results without the construction products outlier.
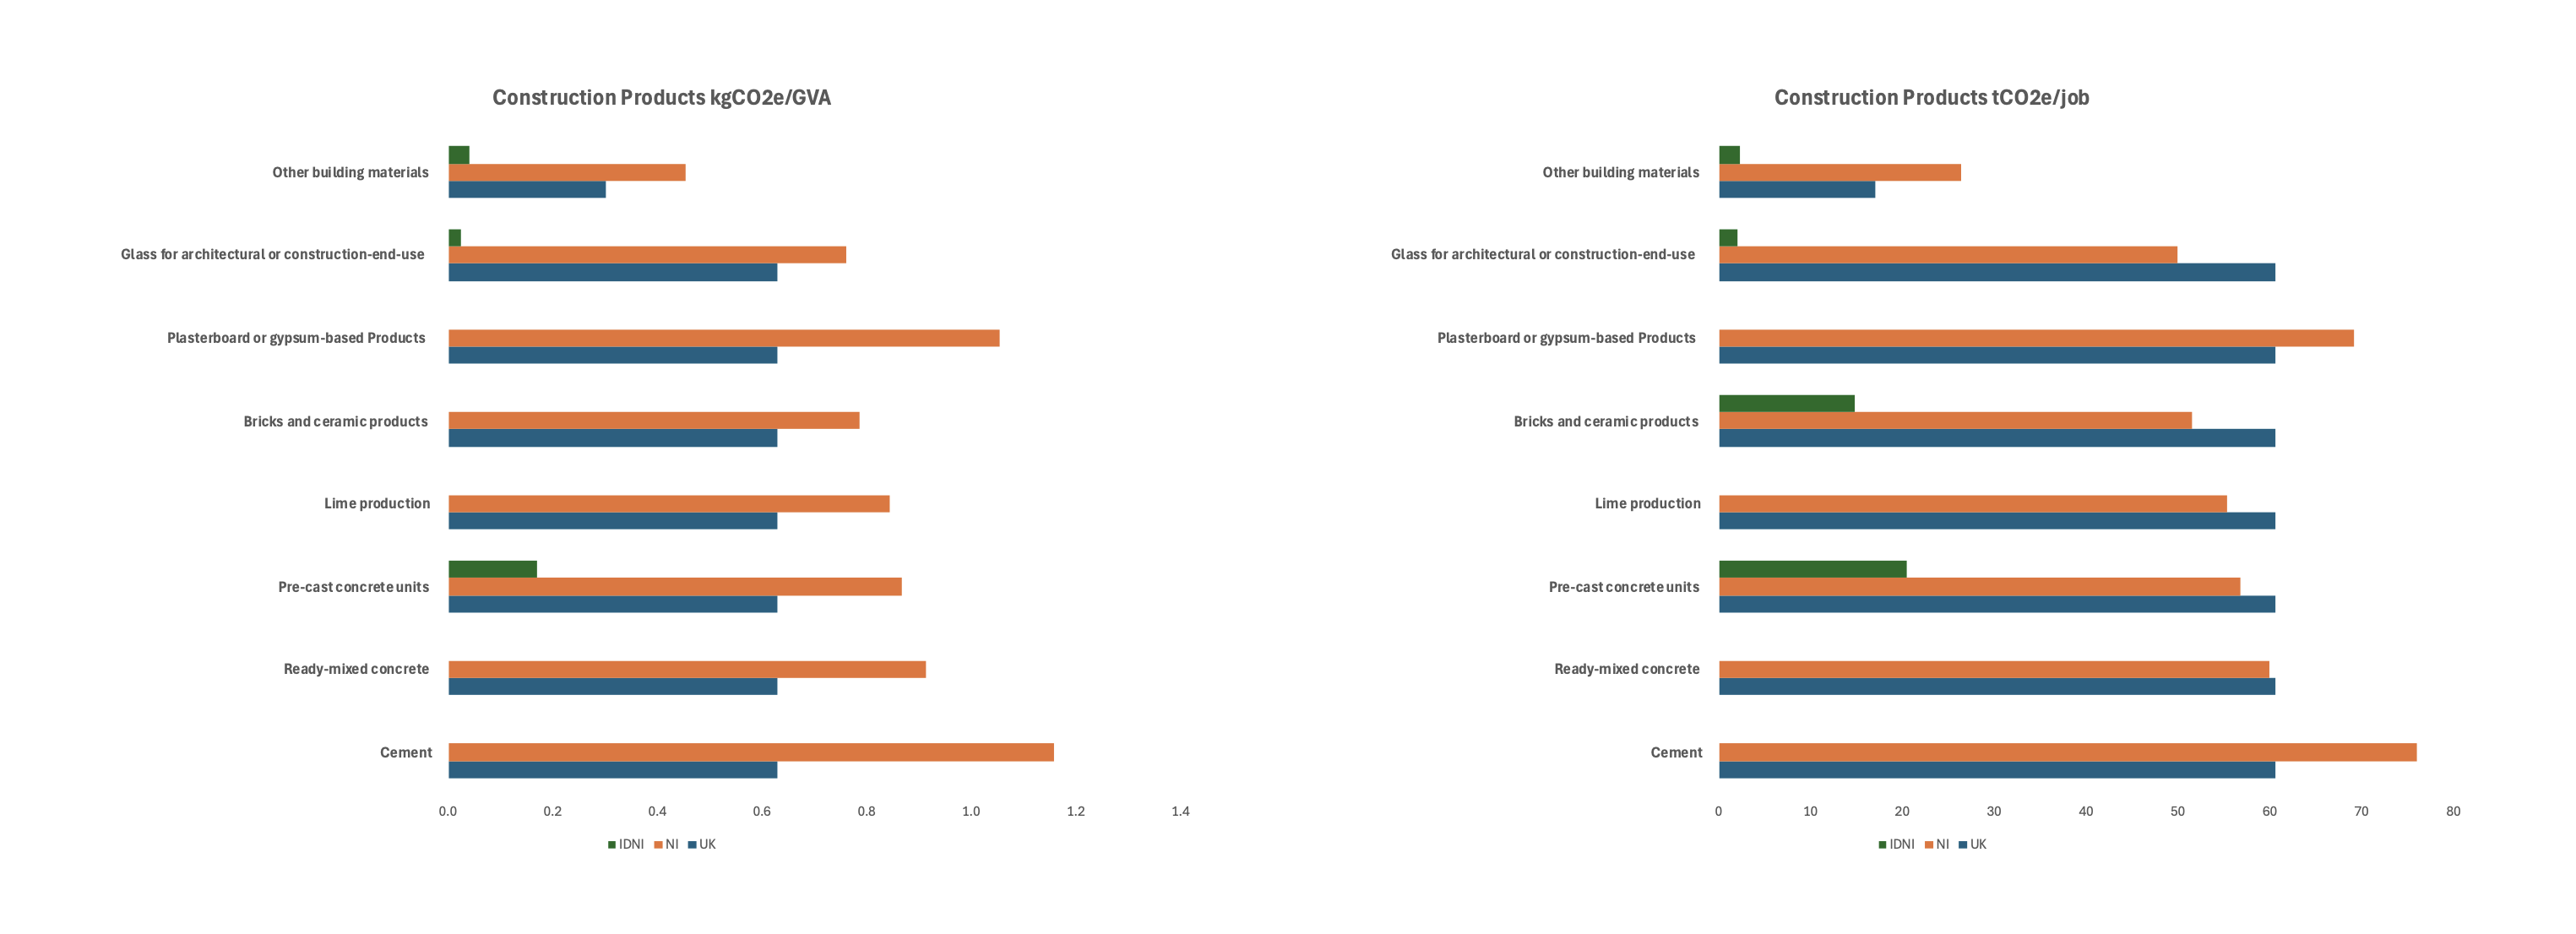
IDNI Data only extends to Glass, Bricks, Pre-cast Concrete and other materials. The data collected for IDNI on both graphs suggests far lower kgCO2e/GVA and tCO2e/job than the UK and using other NI data.
UK Construction Products data for kgCO2e/GVA is represented by a baseline industry estimate.
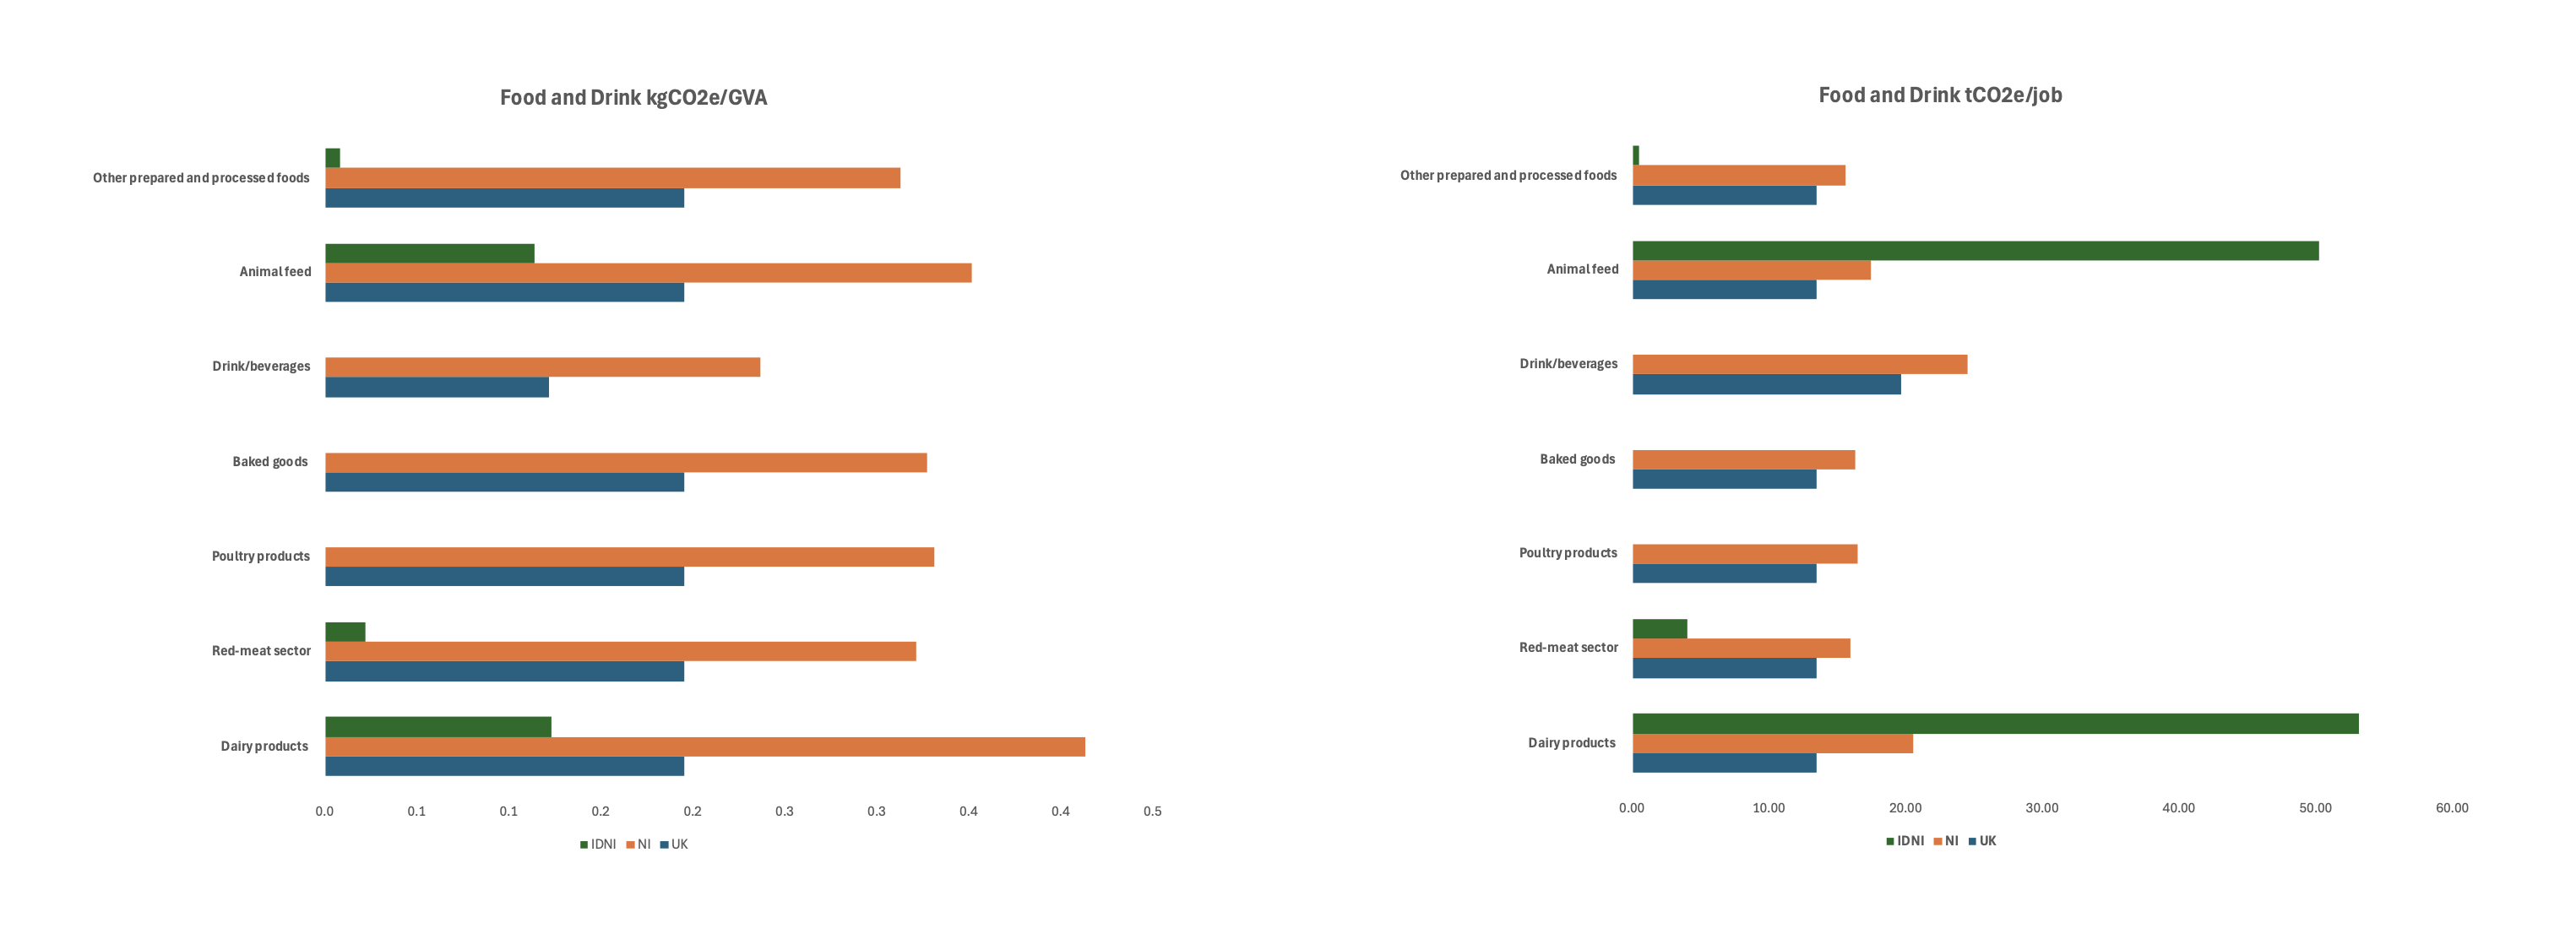
IDNI Data only extends to Animal Feed, Red-Meat, Dairy Products and other foods.
NI and UK exhibit higher kgCO2e/GVA within all sub-sectors. However, when IDNI emissions are compared with jobs, Animal Feed and Dairy products produce far higher levels than in NI and the UK. Suggesting a higher value added per unit of emissions but a lower carbon efficiency of employment.
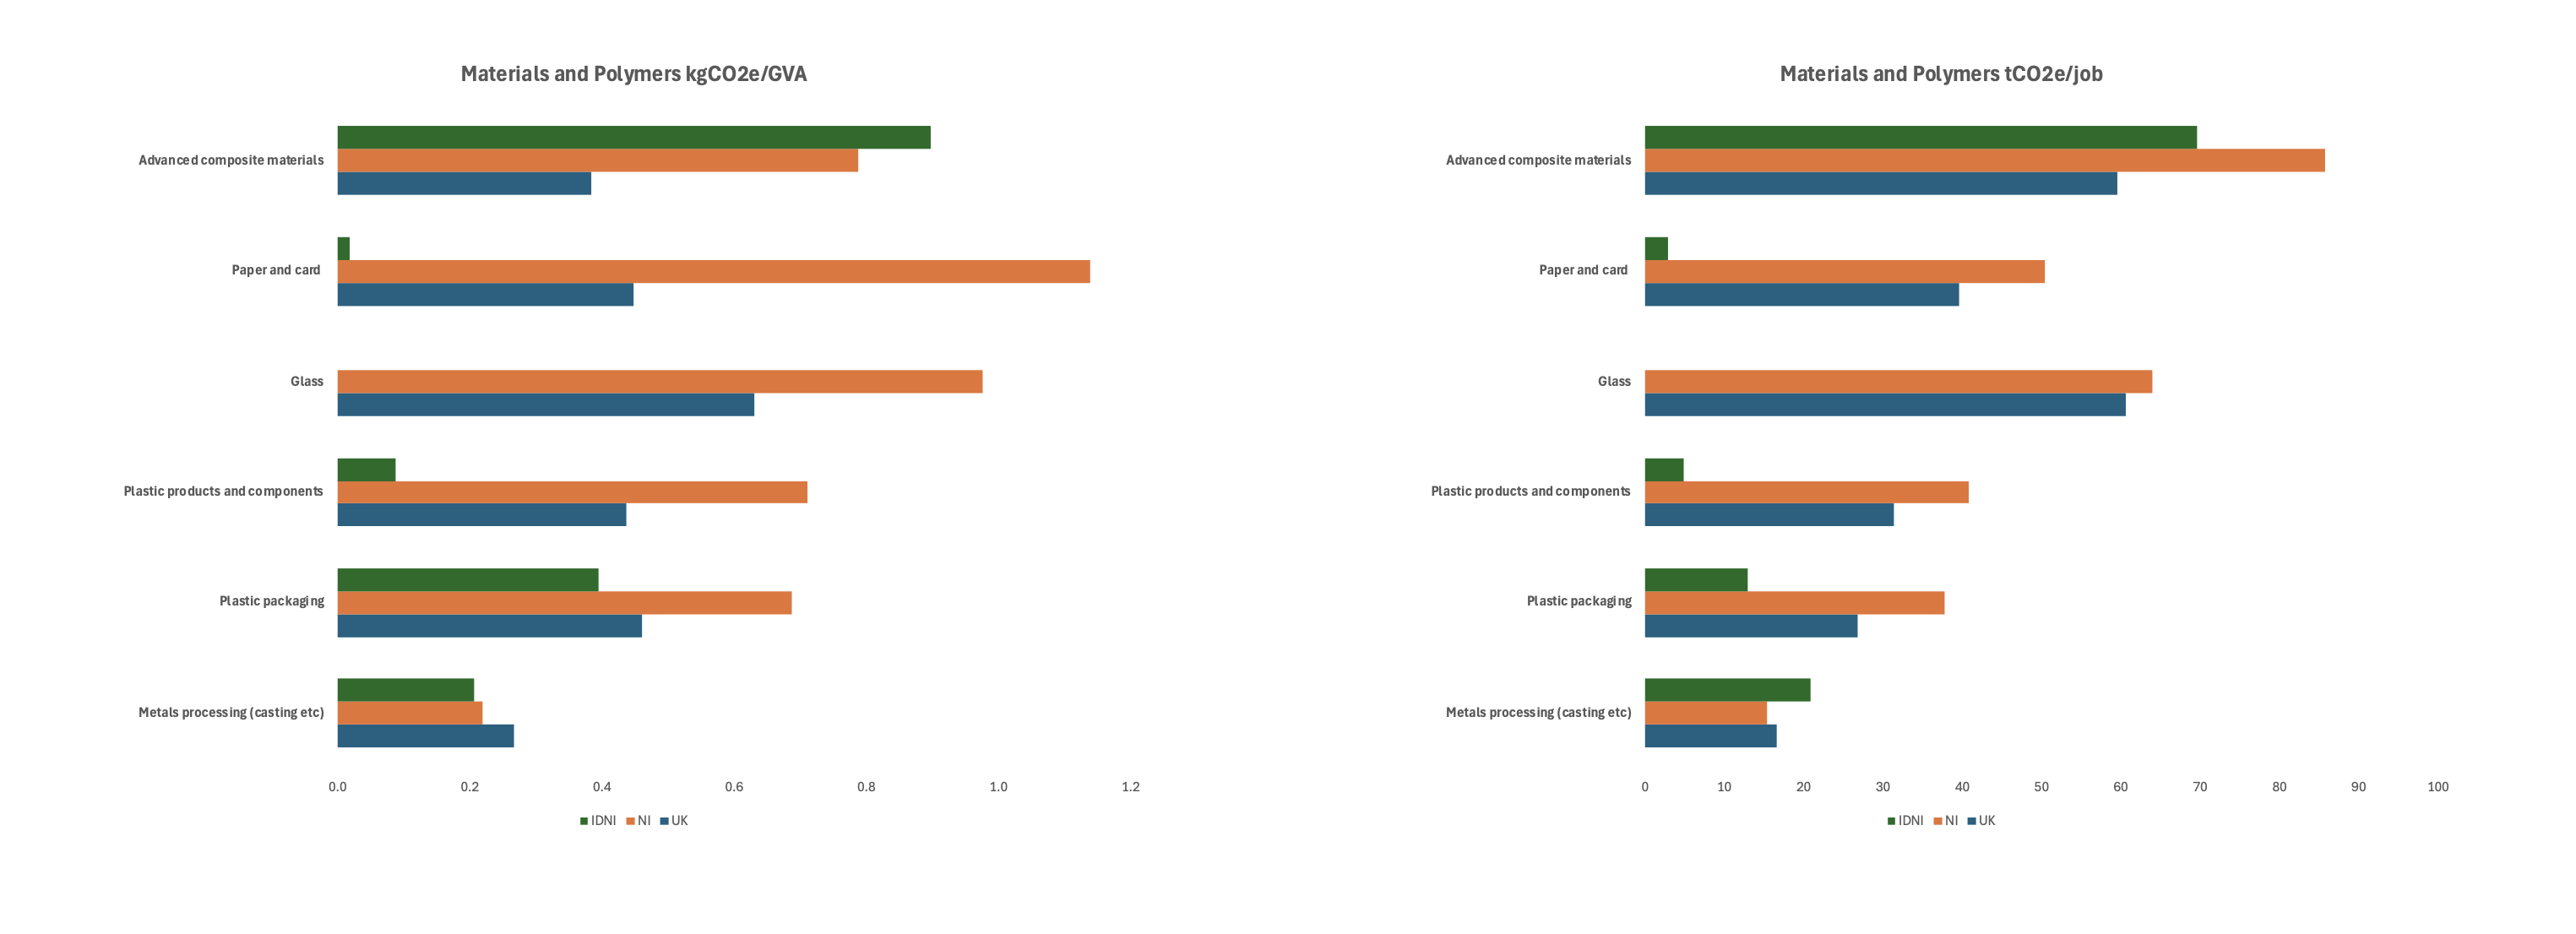
IDNI data for Paper and Card shows a high value-added low emission sub-sector compared with UK and NI data, Plastic Products and Components exhibit a similar pattern. Material, Polymers and Plastics contain the fewest number of companies within IDNI sectoral data (excluding Mining and Quarrying) and so will be most affected by selection bias.
The IDNI data within General Manufacturing contains a lower kgCO2e/GVA and tCO2e/job for all subsectors, with Electronics and Controls being the most extreme case. It is the most represented sector within the datasets and so provides the greatest level of insights into industry benchmarks.
| Northern Ireland Sectoral Average | kWh per Job | tCO2e per kWh | tCO2e per job | GVA per job | kWh per £ GVA |
|---|---|---|---|---|---|
| Construction Products | 168,185 | 0.000236 | 39.75 | £61,435 | 2.74 |
| Food and Drink | 69,376 | 0.000245 | 17.01 | £52,556 | 1.32 |
| General Manufacturing & Engineering | 35,820 | 0.000275 | 9.84 | £78,926 | 0.45 |
| Mineral Products | 153,494 | 0.000213 | 32.77 | £83,728 | 1.83 |
| Materials, Polymers & Plastics | 110,416 | 0.000261 | 28.86 | £65,119 | 1.70 |
| United Kingdom Sectoral Average | kWh per Job | tCO2e per kWh | tCO2e per job | GVA per job | kWh per £ GVA |
|---|---|---|---|---|---|
| Construction Products | 144,314 | 0.000198 | 28.60 | £67,199 | 2.15 |
| Food and Drink | 73,113 | 0.000197 | 14.41 | £83,159 | 0.88 |
| General Manufacturing & Engineering | 38,068 | 0.000205 | 7.79 | £103,690 | 0.37 |
| Mineral Products | 181,333 | 0.000165 | 29.96 | £564,046 | 0.32 |
| Materials, Polymers & Plastics | 107,374 | 0.000211 | 22.64 | £66,856 | 1.61 |
| Sectoral Average kWh per Job | Construction Products | Food and Drink | General Manufacturing & Engineering | Mineral Products | Materials, Polymers & Plastics |
|---|---|---|---|---|---|
| Northern Ireland | 168,185 | 69,376 | 35,820 | 153,494 | 110,416 |
| United Kingdom | 144,314 | 73,113 | 38,068 | 181,333 | 107,374 |
| Sectoral Average tCO2e per kWh | Construction Products | Food and Drink | General Manufacturing & Engineering | Mineral Products | Materials, Polymers & Plastics |
|---|---|---|---|---|---|
| Northern Ireland | 0.000198 | 0.000197 | 0.000205 | 0.000165 | 0.000211 |
| United Kingdom | 0.000236 | 0.000245 | 0.000275 | 0.000213 | 0.000261 |
| Sectoral Average tCO2e per Job | Construction Products | Food and Drink | General Manufacturing & Engineering | Mineral Products | Materials, Polymers & Plastics |
|---|---|---|---|---|---|
| Northern Ireland | 39.75 | 17.01 | 9.84 | 32.77 | 28.86 |
| United Kingdom | 28.60 | 14.41 | 7.79 | 29.96 | 22.64 |
| Sectoral Average GVA per Job | Construction Products | Food and Drink | General Manufacturing & Engineering | Mineral Products | Materials, Polymers & Plastics |
|---|---|---|---|---|---|
| Northern Ireland | £61,435 | £52,556 | £78,926 | £83,728 | £65,119 |
| United Kingdom | £67,199 | £83,159 | £103,690 | £564,046 | £66,856 |
| Sectoral Average kWh per £ GVA | Construction Products | Food and Drink | General Manufacturing & Engineering | Mineral Products | Materials, Polymers & Plastics |
|---|---|---|---|---|---|
| Northern Ireland | 2.74 | 1.32 | 0.45 | 1.83 | 1.70 |
| United Kingdom | 2.15 | 0.88 | 0.37 | 0.32 | 1.61 |

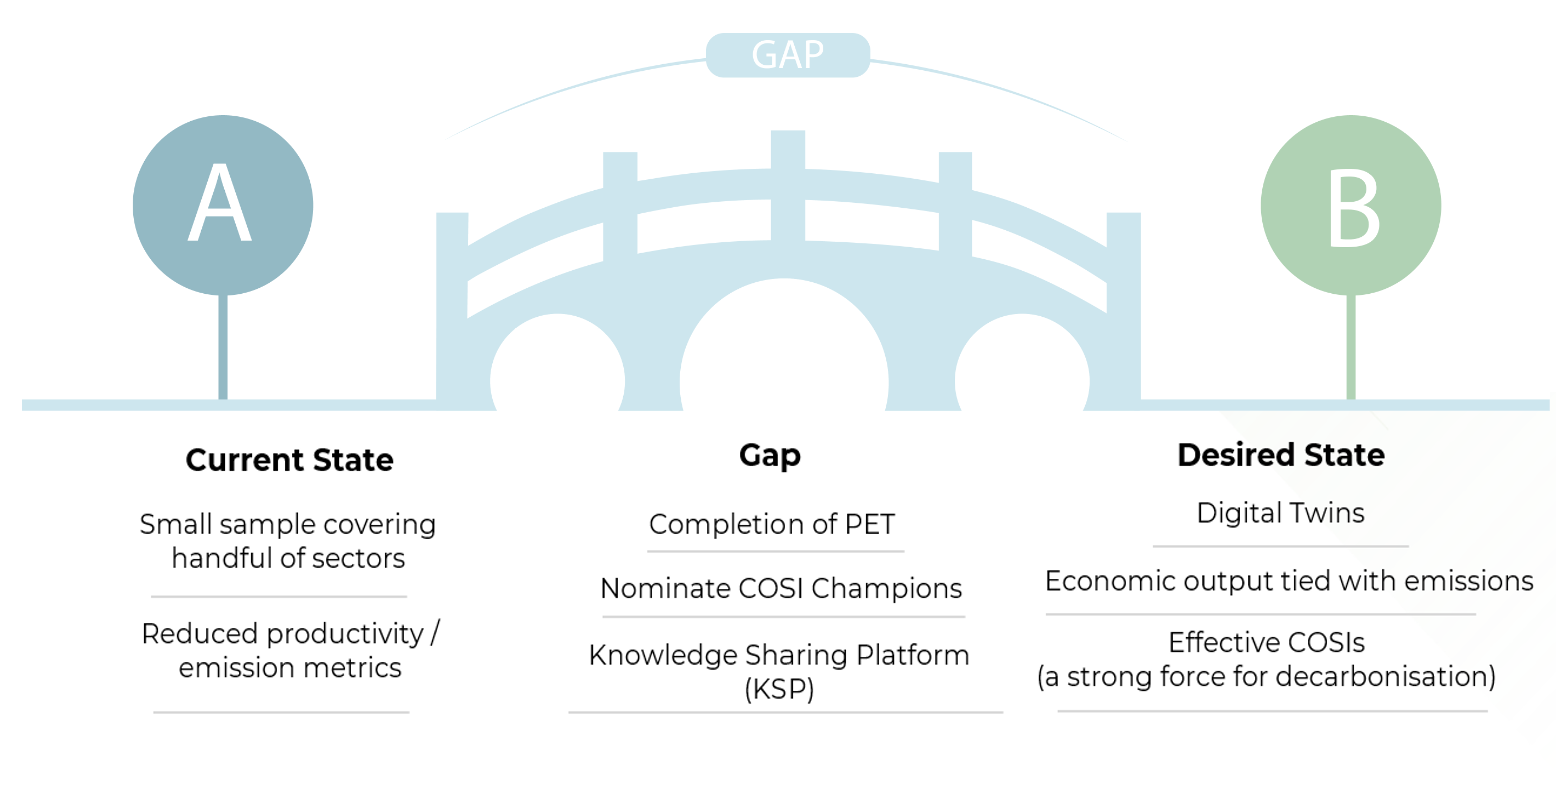
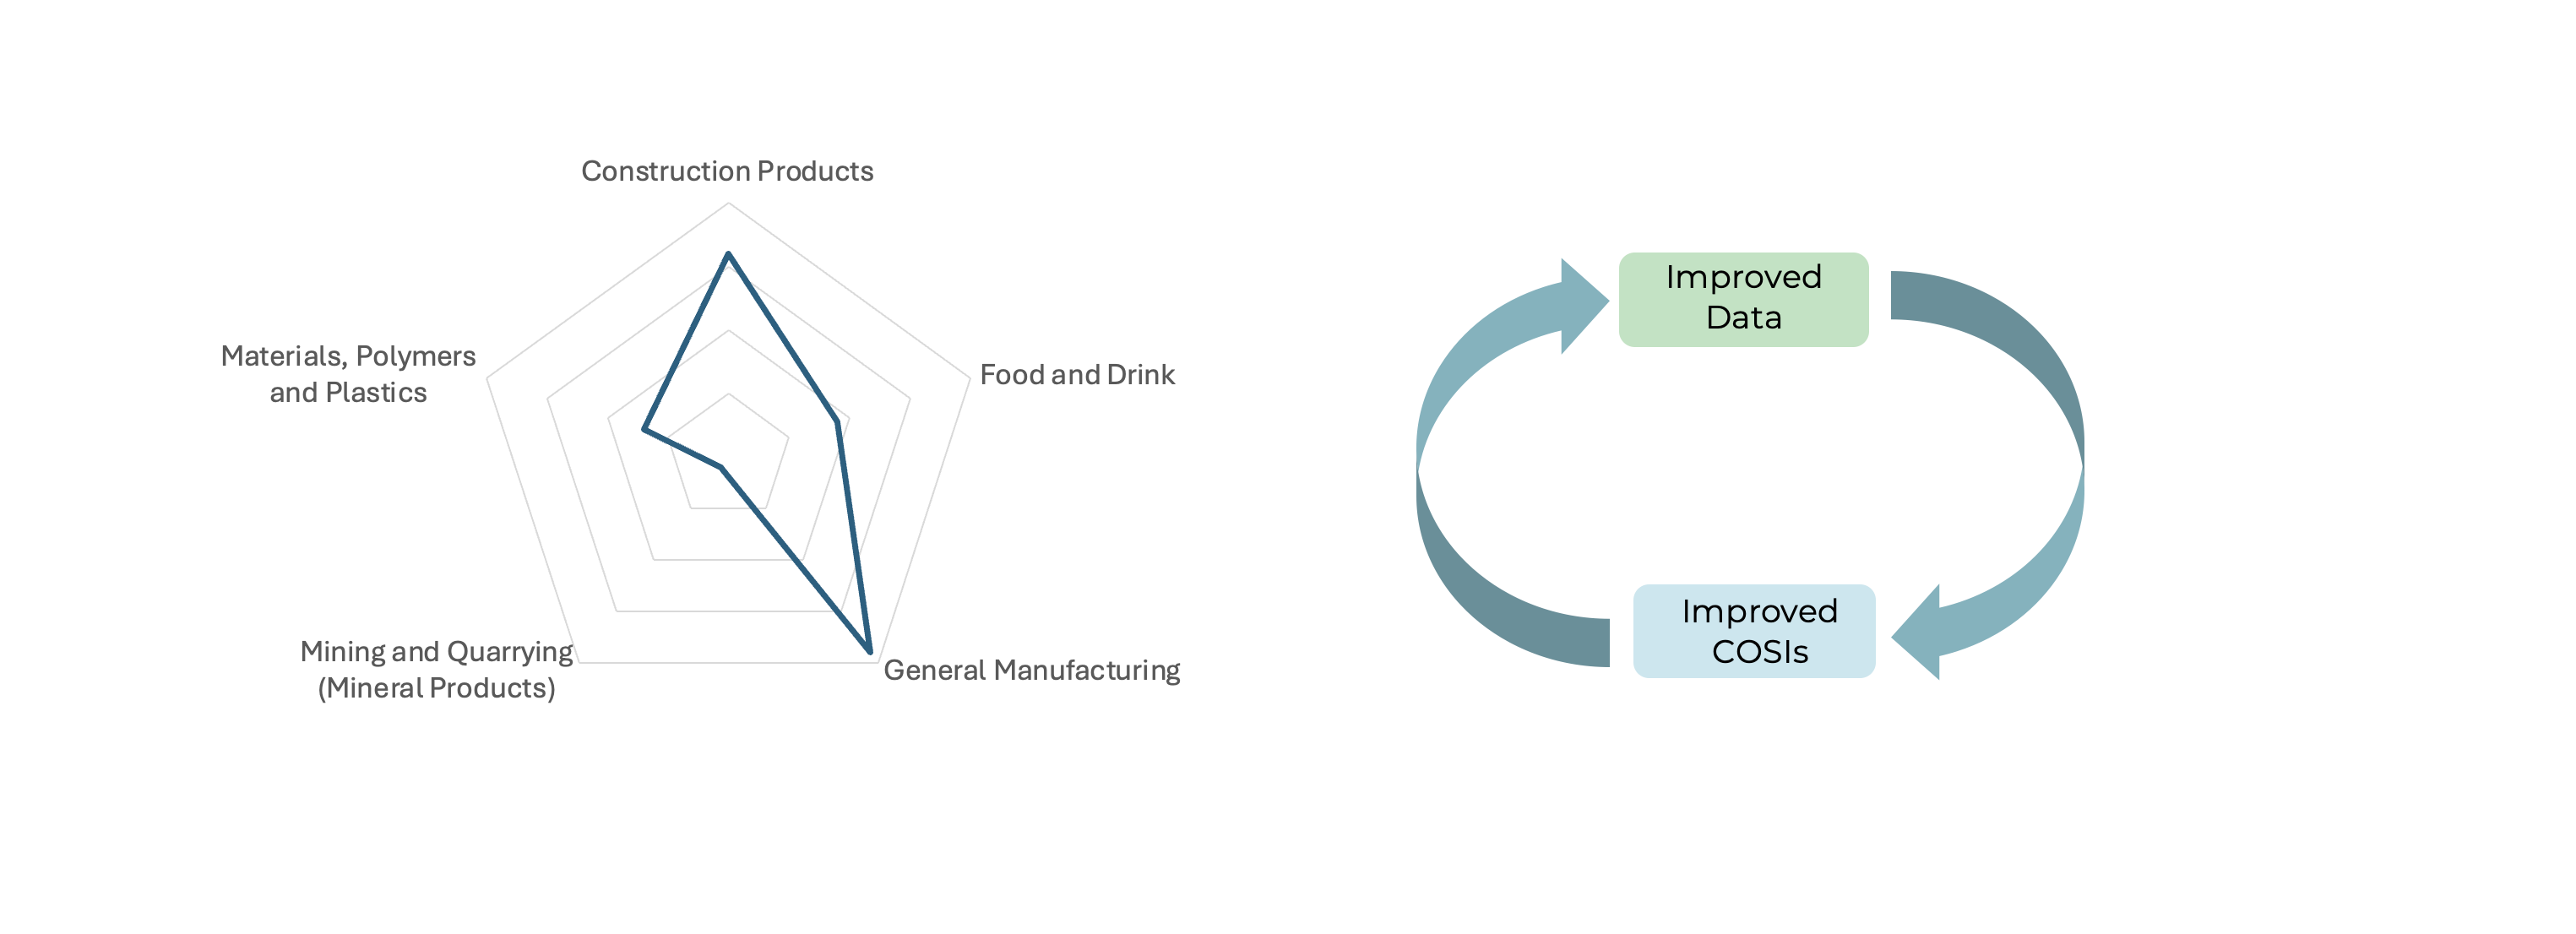
Gaps in data points results in some large sectors of Northern Ireland being underrepresented.
Having a full view of Northern Ireland sectors, focused on productivity and emission data will highlight specific industrial shortfalls.
Use of the Productivity and Emissions Tool (PET) and engagement in Communities of Shared Interest (COSIs) will facilitate an improvement in available data.
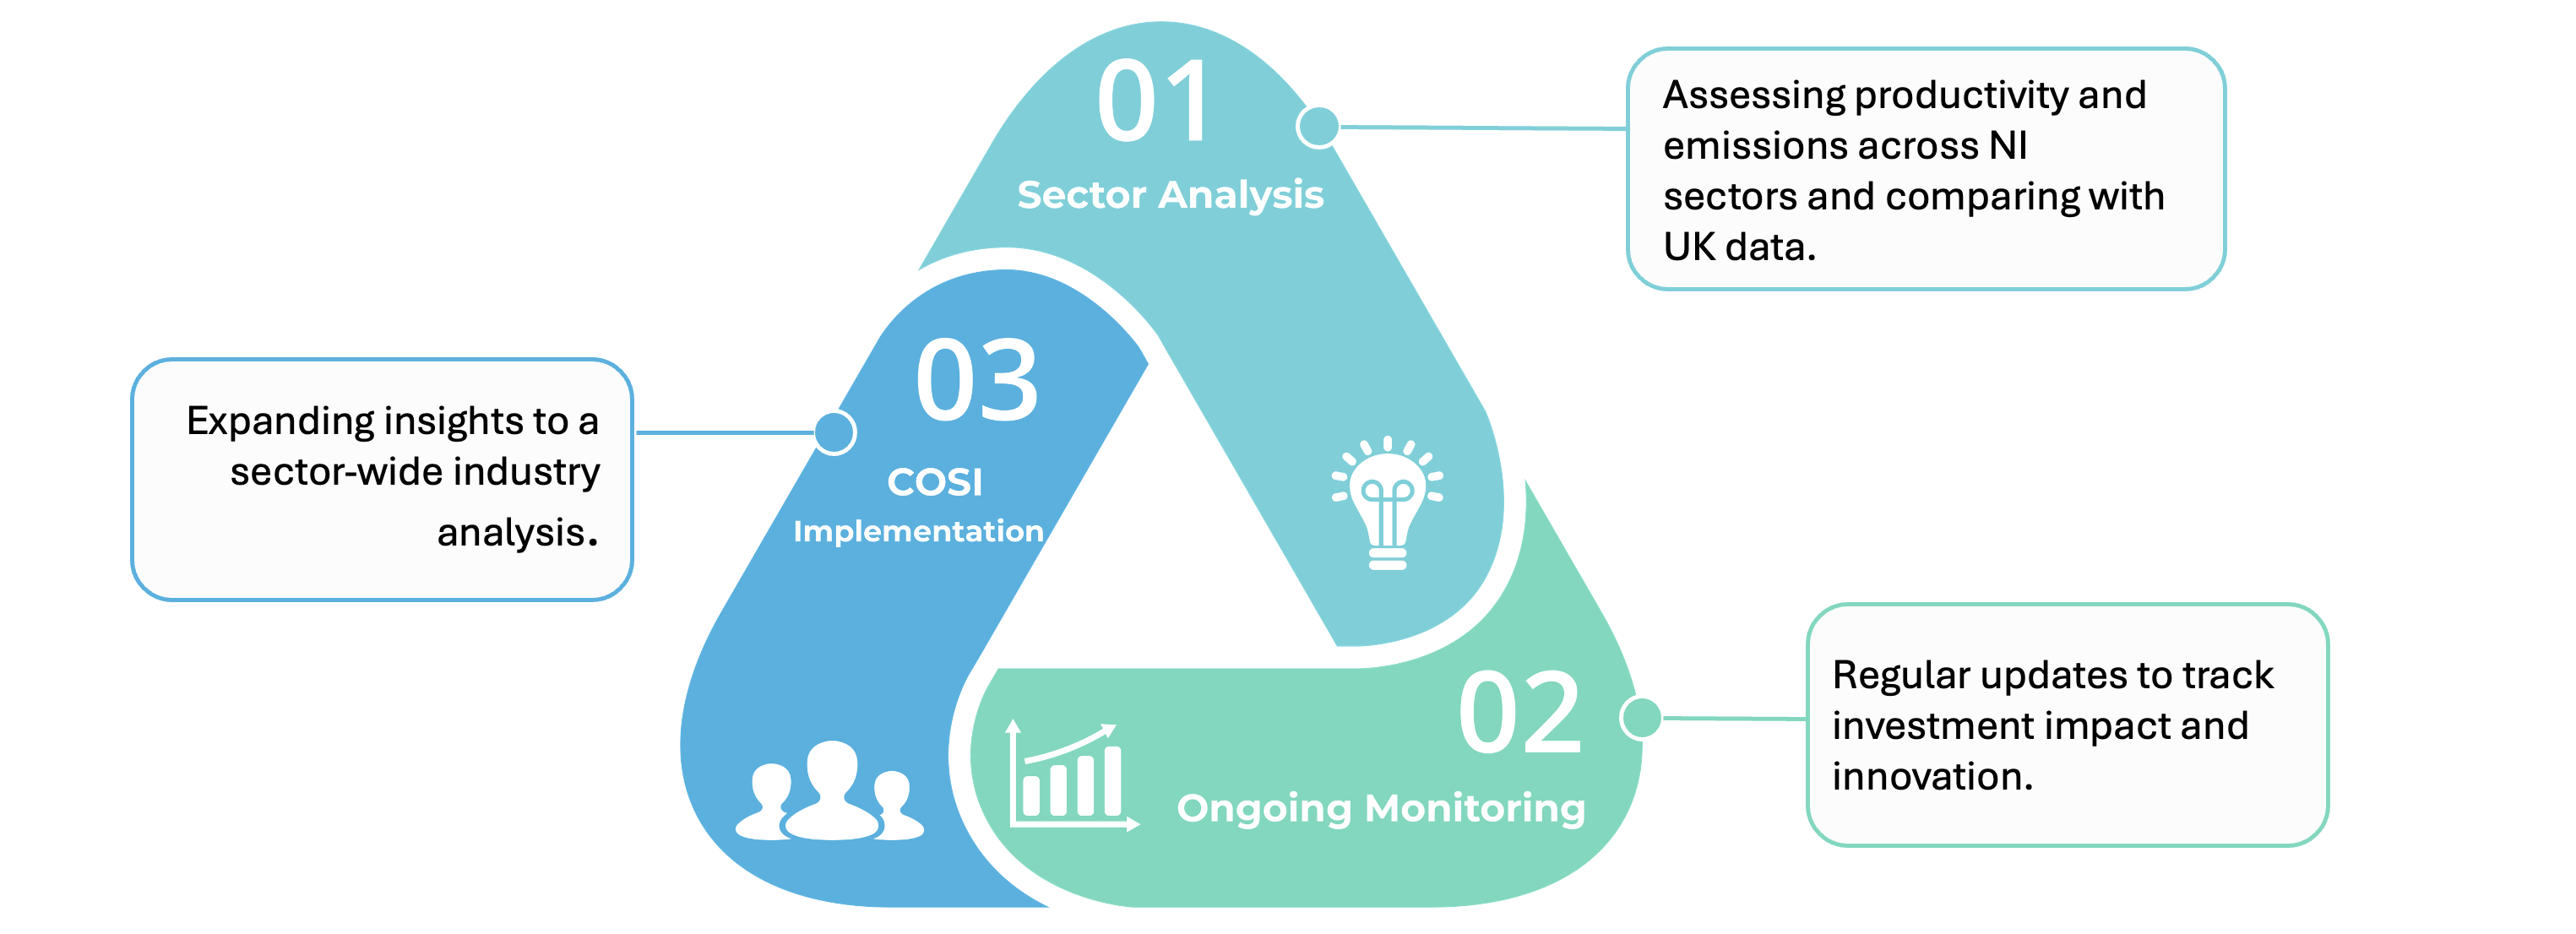
PET benchmarks company productivity across UK sectors using SIC codes for COSI formation, allowing companies to upload key productivity factors like energy, transport, and raw materials.
IDNI Portal shows consumption and emission profile, which, when combined with PET data, Gross Value Added (GVA), and COSI, generates industry benchmarks.